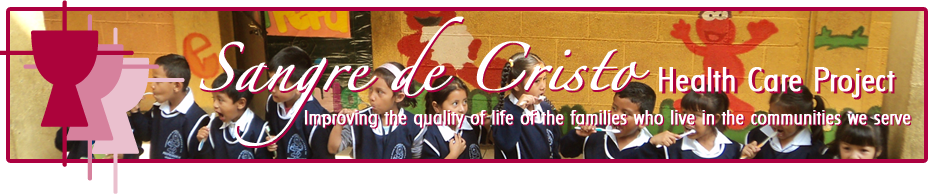

Program Services and Statistics
| 2007 | 2008 | 2009 | 2010 | 2011 | 2012 | 2013 | 2014 | 2015 | 2016 | |
Patients Served in Medical Clinics |
18,211 | 18,047 | 17,367 | 17,067 | 15,526 | 17,181 | 17,685 | 18,845 | 20,843 | 21,448 |
Persons Served in Community Pharmacies |
20,769 | 18,906 | 18,239 | 19,029 | 17,700 | 18,734 | 19,378 | 18,746 | 18,939 | 19,382 |
Patients Served in Dental Clinics |
3,044 | 2,810 | 3,206 | 3,014 | 2,702 | 2,773 | 2,643 | 2,639 | 2,756 | 2,840 |
Laboratory Exams Performed |
9,695 | 9,787 | 9,686 | 10,476 | 9,931 | 13,247 | 14,867 | 15,459 | 14,641 | 16,175 |
Persons Served in Medical, Dental and Surgical Day Campaigns |
491 | 1,617 | 1,156 | 1,186 | 2,008 | 2,568 | 2,601 | 2,946 | 3,371 | 3,040 |
Participating Students in Healthy Habits Program |
2,379 | 2,379 | 2,645 | 900 | 820 | 978 | 841 | 605 | 700 | 688 |
Children Participating in Dental Health Education |
11,083 | 11,389 | 12,144 | 12,102 | 12,735 | 11,509 | 12,268 | 12,590 | 17,396 | 12,445 |
Students Participating in Fluoride Program |
4,546 | 4,785 | 5,065 | 5,168 | 5,183 | 5,571 | 4,256 | 5,226 | 2,823 | 2,432 |
Fluoride Swishes Given |
31,723 | 35,969 | 31,170 | 134,000 | 165,000 | 187,589 | 112,434 | 102,753 | 90,336 | 65,180 |
Persons Served in Vaccination Program |
1,605 | 1,562 | 1,026 | 3,994 | 18 | N/A | N/A | N/A | N/A | N/A |
Children Participating in Education Ecology Talks |
12,689 | 13,541 | 15,791 | 13,899 | 15,361 | 13,400 | 13,985 | 13,999 | 12,079 | 13,572 |
Projects Completed in Environmental Health and Sanitation Services |
231 | 255 | 270 | 1,545 | 5,921 | 4,106 | 119 | 91 | 154 | 165 |
Trees Planted |
N/A | N/A | 6,220 | 13,466 | 7,789 | 6,855 | 6,995 | 6,736 | 8,246 | 6,309 |
Community Health Education |
N/A | N/A | 1,040 | 2,613 | 2,770 | 2,679 | 3,767 | 7,123 | 4,829 | 3,766 |
| TOTAL | 116,466 | 121,047 | 118,805 | 104,459 | 98,464 | 99,681 | 99,365 | 105,005 | 106,777 | 102,262 |